
White-Label Reports for the AI Era: Essential Templates and Metrics
How to build professional reports that prove the value of AI visibility. Includes templates, AEO metrics and cases from agencies that increased client retention.
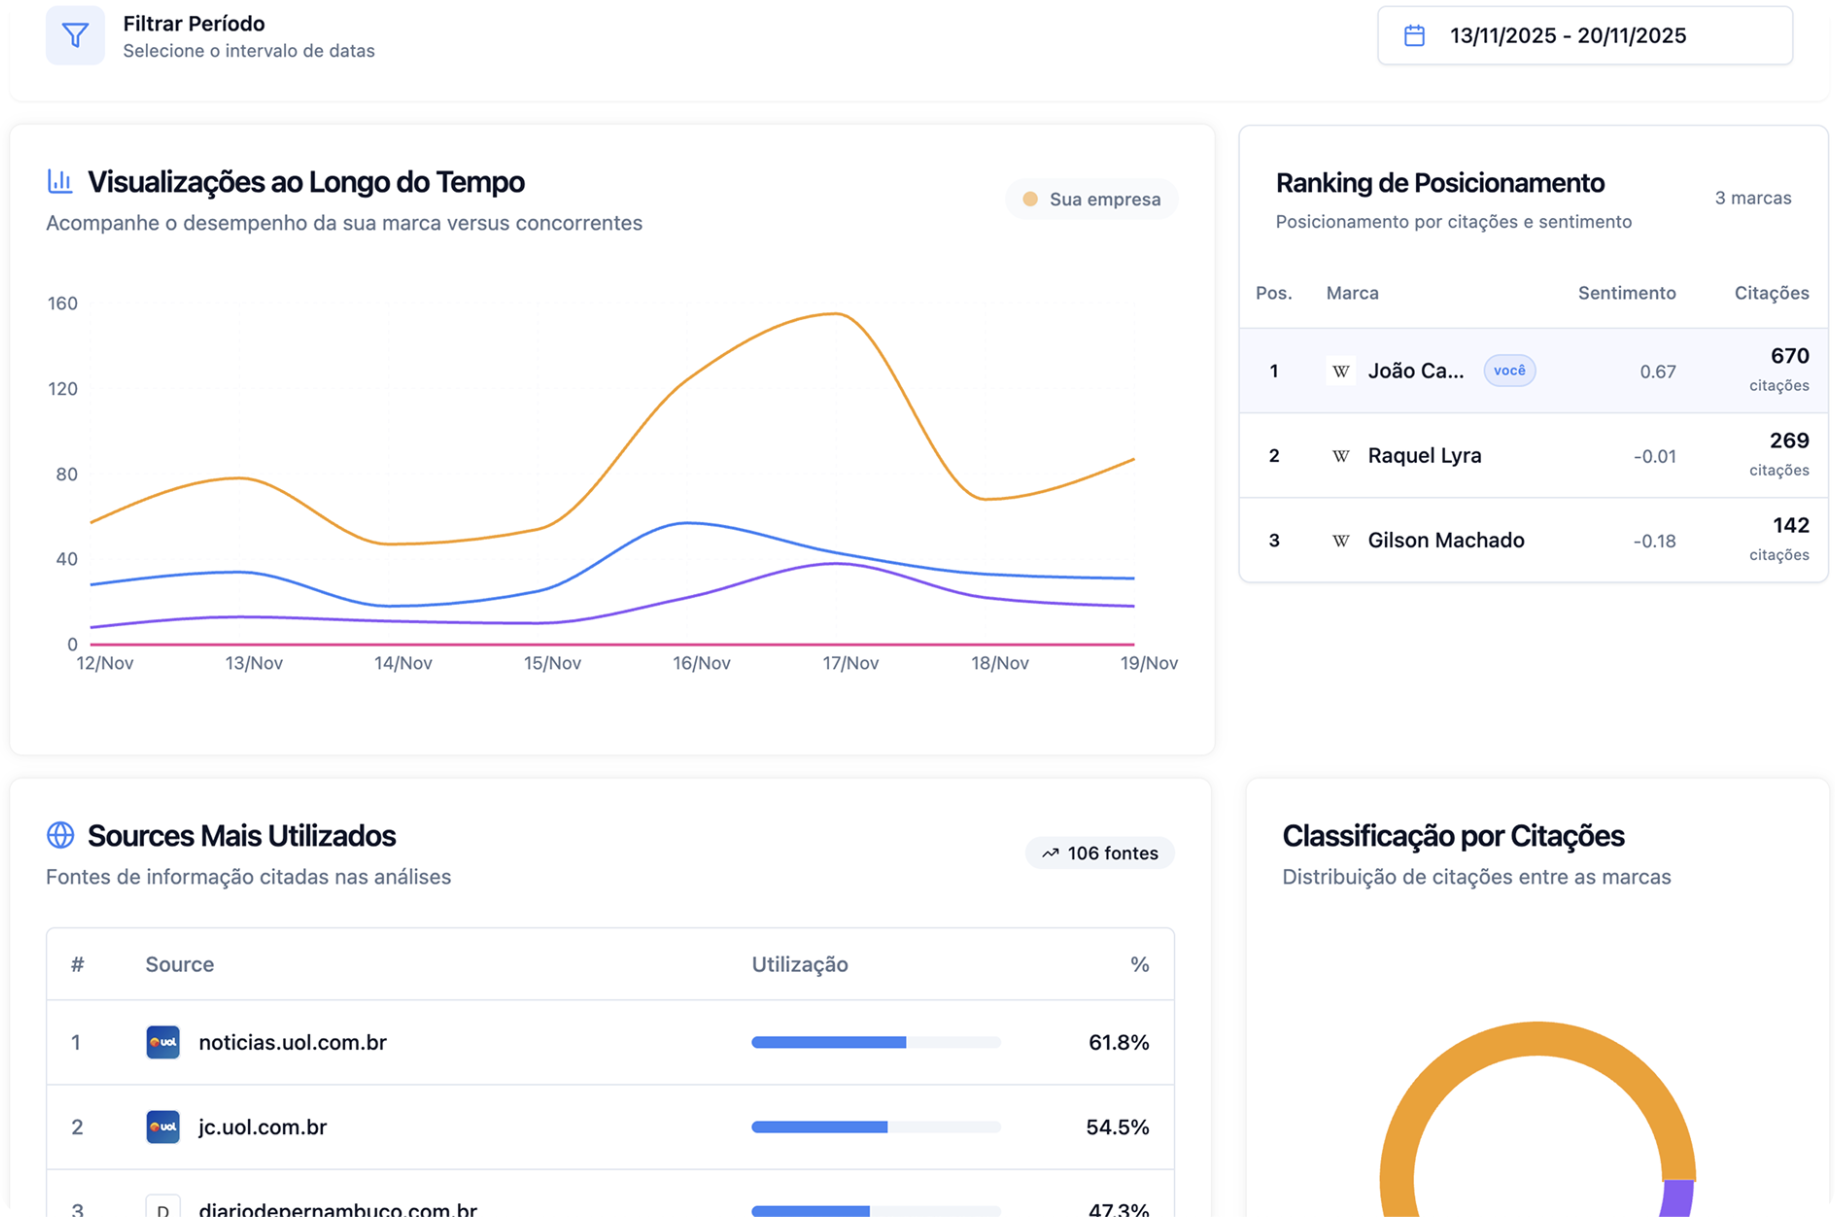
The AI era demands that agency reporting evolve. Clients who do not understand concepts like "Answer Engine Share" or "AI Mention Score" will question the value of the service. This guide provides templates and methodologies for demonstrating ROI on AI visibility.
Core Metrics for the AI Era
1. Answer Engine Share (AES)
Definition: the percentage of times your brand is mentioned when an AI answers questions in your niche.
Formula: (brand mentions / total relevant queries) × 100
Benchmark: 15-25% is considered excellent in competitive niches
2. AI Mention Score (AMS)
Definition: the quality and context of mentions inside AI answers.
Components:
- Placement within the answer (first 20% = maximum score)
- Positive vs. neutral vs. negative context
- Specificity of the recommendation
- Presence of an implicit call to action
3. Prompt Volume Analysis (PVA)
Definition: trends in AI queries related to your market.
Metrics:
- Monthly query volume per category
- Prompt seasonality
- Emerging questions (new trending queries)
- Competitive prompt analysis
Executive Report Template
Page 1: Executive Summary
🎯 Executive Summary - [Month/Year]
Answer Engine Share: 23% (+8% vs. previous month)
AI Mention Score: 8.2/10 (+1.3 vs. previous month)
Prompt Volume: 15.2K relevant queries (+12% MoM)
Estimated ROI: R$ 85,000 in pipeline attributable to AI visibility
Page 2: Visibility by Platform
| Platform | Share % | Mention Score | Trend |
|---|---|---|---|
| ChatGPT | 28% | 8.5/10 | 📈 +5% |
| Claude | 22% | 7.8/10 | 📈 +3% |
| Google AI | 19% | 8.1/10 | 📈 +7% |
| Perplexity | 15% | 7.2/10 | 📈 +2% |
Templates by Segment
E-commerce
📊 Segment-specific metrics:
- Product Mention Rate: % of times products are recommended
- Purchase Intent Score: quality of the buying context
- Category Dominance: share by product category
- Seasonal AI Trends: mention swings across the year
B2B SaaS
📊 Segment-specific metrics:
- Use Case Coverage: % of use cases where you appear
- Comparison Advantage: positioning against competitors
- Implementation Mentions: frequency in implementation guides
- ROI Context Score: quality of ROI-related mentions
ROI and Business Impact Section
Calculation Methodology
Attributable pipeline = (AI traffic × conversion rate × average deal size) + (brand lift × estimated impact)
Worked Example
💰 Monthly Financial Impact
AI traffic: 1,250 unique visitors
AI conversion rate: 8.2% (vs. 2.1% for traditional organic)
Average lead value: R$ 850
Direct pipeline: R$ 87,125
Estimated brand lift: +15% in awareness (R$ 12,000 estimated value)
Total monthly ROI: R$ 99,125
Storytelling With Data
The Growth Narrative
Instead of only showing numbers, tell the story:
- "Where we were" — the AI visibility baseline
- "What we did" — the strategies we implemented
- "What we achieved" — metrics and impact
- "What comes next" — the opportunities we found
AI Quotes
Include real examples of how AIs mention the brand:
"For digital marketing agencies looking for efficiency, [Brand] offers the best combination of advanced features and ease of use..."
Automation and Tooling
Recommended Stack
- Data collection: custom monitoring scripts
- Report generation: Google Data Studio, Power BI
- Design: Canva Pro, Adobe Creative Suite
- Delivery: automated email, client portal
Ideal Cadence
- Executive summary: monthly
- Detailed analysis: quarterly
- Competitive updates: twice a year
- Strategy review: annually
Success Stories
Agency A: +40% Retention
Rolling out AI reporting lifted client retention from 75% to 92% once the visibility gains became tangible.
Agency B: +25% Average Contract Value
Clients invested more once they understood the AI visibility upside, raising the average contract from R$ 8K to R$ 10K per month.
Implementation Checklist
✅ Before launch:
- ☐ Monitoring tools set up
- ☐ Benchmarks defined per client
- ☐ Branded templates created
- ☐ Team trained
✅ First report:
- ☐ AI visibility baseline established
- ☐ Initial competitive analysis
- ☐ Opportunities identified
- ☐ ROI framework defined
White-label reports built for the AI era are not just a way to demonstrate value — they are retention and account growth tools. Agencies that master them will hold a substantial competitive advantage.
Enjoyed this article?
Get in touch